Modern-day policing faces myriad challenges aside from the duties of the job itself. In the past decade, law enforcement has become the spotlight of many politically charged conversations by community members and lawmakers. Methodologies and techniques being used to fight crime are under the microscope, as is the training of police personnel. An examination of ever-changing policing theories has become more important than ever in reducing crime levels while maintaining the integrity of the profession. Policing has migrated through several models in a relentless attempt to effectively combat crime.
Policing Models
Traditional policing is very reactive. In essence, an event occurs, and the police respond. There is not much forethought given into when or where resources should be allocated other than designating police districts. This method uses the community to restore property damage and the perception of safety, rather than prevent crime.1
Community-oriented policing has three major pillars: (1) community partnerships through which the police form alliances with local individuals and organizations to combat crime; (2) organizational transformation where departments are logistically rearranged so that personnel can be dedicated purely to partnerships with the community; and (3) problem-solving to address the issues that have been identified through the partnership with the community. This method was officially studied in both the Cincinnati Team Policing Experiment in the late 1960s and The Dallas Experiment in the 1970s. One of the largest hurdles that these experiments revealed was the alienation of the community as a result of the secretive methods of the police along with the authority that has been allocated to police officers.2
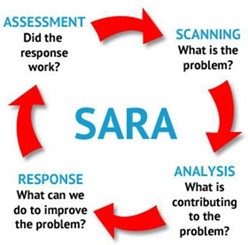
The SARA Model is often used along with most other models, including community policing. The acronym stands for Scan, Analyze, Respond, Assess. This is an evaluation process that can happen tactically, in the matter of seconds, or strategically planned over time.3
CompStat (computer-aided statistics) policing originated in the 1990s at the New York City Police Department. The purpose of CompStat was to increase accountability of the officers and, moreover, the supervisors within a geographic region of a police jurisdiction. Regular meetings were held in which the regional commander (or equivalent) was expected to identify the needs of that particular area over the course of the following weeks. This included crime patterns, hotspots, and general nuisance issues. At the next meeting, the commander would report back on whether the strategy had in fact lessened the issue that had been identified. CompStat has a wide continuum of outcomes that vary between the extreme and polar ends of job termination to information sharing.4
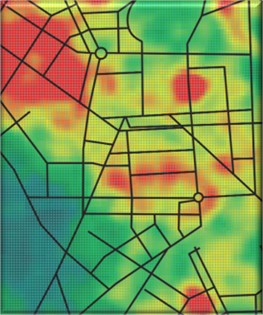
Hotspot policing requires the identification of a “hotspot” and then efforts to reduce the “hotness.” This method assumes two vital flaws: (1) that all geographic areas are populated with similar density, and (2) that the spot will not continue to be “hot” regardless of the resources that are deployed. Examples of common hotspots include mobile home parks, apartment complexes (dense housing areas), and socioeconomically challenged neighborhoods.5
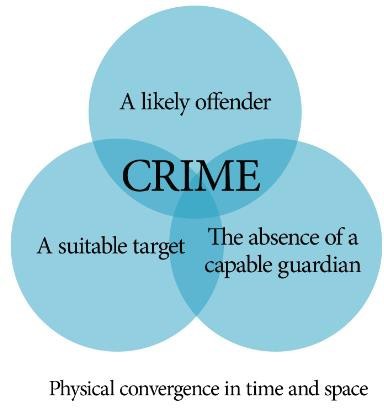
The Crime Triangle is the underlying theoretic principle of what circumstances must exist for, and therefore be viable options to prevent, a crime from taking place. The Crime Triangle was developed in conjunction with the Routine Activity Theory in 1979 by Lawrence Cohen and Marcus Felson, suggesting that if a motivated offender, a suitable target, and the absence of a capable guardian all come together in time and space, a crime takes place.6
Law Enforcement Data
The Federal Bureau of Investigation, in an effort to standardize the reporting of crime data throughout the United States, established Uniform Crime Reporting (UCR) in 1907. Every police jurisdiction was encouraged to submit their data to the summary reporting system (SRS), and the FBI subsequently published these crime rates for the public to see. This method used the SRS hierarchy rule, which noted only the most severe crime for each incident; for example, “murder” would be listed, but lesser crimes that took place during the same incident would not appear in the data. In the early 2000s, law enforcement agencies began migrating to a new system of reporting called the National Incident Based Reporting System (NIBRS), which falls under the umbrella of UCR along with other data collections. NIBRS counts all the criminal elements of an event separately, therefore increasing the overall crime statistics in appearance. For example, an event might have begun as (1) a burglary that resulted in (2) an assault and (3) theft, which would be recorded in all three criminal categories.
 The breakdown of these numbers for a law enforcement agency, as well as information from numerous other data sources, is best performed by a trained analyst. One of the skills of an effective crime data analyst is the ability to collect data from numerous, disparate sources and collate it into a repository that is satisfactory for analysis. Common sources include police reports, dispatch data (calls for service), field interview cards, inmate provided intelligence, and of course open-source intelligence (OSINT) data. OSINT data incorporate social media data, web articles, and even dark web information pertaining to a person, location, or event.
Crime Data Analysts
The implementation of crime and intelligence analysts into law enforcement agencies over the past 30 years has been a turning point in policing methods, albeit misunderstood and tumultuous at times. At larger agencies, there is often a breakdown of the various types and specialties of analysts, including but not limited to crime analysts, intelligence analysts, and investigative analysts.
There are often even subsets of these categories including a crime specialty or geographic assignment, such as “robbery analyst” or “District 3 analyst.” The point of crossover, however, is that all criminal analysts are essentially data analysts. The functions of criminal justice data analysis are mirrored in many fields. Large corporations have business intelligence analysts, and entities that are particularly vulnerable to threats such as financial institutions have threat analysts. Data analysts of all accords have a common goal—they are seeking to find strategies among the data, evidence if you will, of what works and what doesn’t in impacting the named topic.
Take, for instance, the Insurance Institute for Highway Safety, which uses data to determine vehicle safety ratings. These data include crash severity and crash mitigation. The goal is to identify the safest vehicles that are on the road.
Likewise, criminal trials rely on juries to use the evidence and data that are presented before them to make the determination of a subject’s guilt or innocence in the commission of a crime. Forensic information is presented, and a matrix is used to decide if a threshold has been met.
Crime fighting is no different. Data are needed to make an informed decision as to the best strategy to mitigate a problem. A crime data analyst’s role is a support role that aids in the decision-making process of officers and command staff. Data fuel resource allocation, help to identify crime patterns, justify redistricting, and answer the question of when and where officers can be most effective. Data also provide administrative answers to officer efficacy, call load, and response times.
Emerging Technologies
Much like the rest of society, law enforcement has new cutting-edge technology. In the case of policing, that technology is geared toward mitigating the latest crime trends.

One example of this is the improved capability of obtaining the data that is held on a vehicle’s infotainment system. The infotainment system is essentially a computer that stores contact details, GIS data, and other ancillary information about both the vehicle and the driver, it has become an important part of the forensic data collection used in investigations.
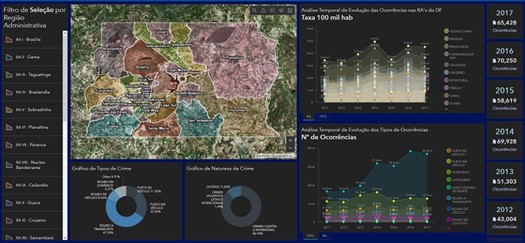
Another leap forward in technology that allows law enforcement to get in front of emerging trends is the implementation of GIS dashboards. These dashboards can be provided with a constant stream of data from dispatch (CAD) and crime record management systems (RMS) that allow analysts and administrators to create analysis at the click of a button. Complete with interactive graphics of temporal and geographic information, crime data can be sliced and diced to see crime from just about any angle, providing insight into effective prevention or response strategies.
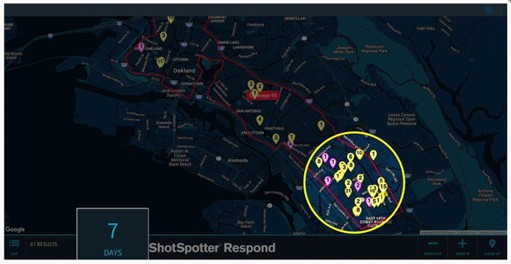
In conjunction with the ever-growing number of police surveillance cameras is technology such as gunshot detection systems. These systems can feed data directly onto a map that allows for spatial analysis and a targeted response.
What these emerging technologies ensure is that there will always be a continuing need for education among analysts. Staying up to date with the cutting-edge methodologies and techniques requires time to learn their practical applications.
Data-Driven Success
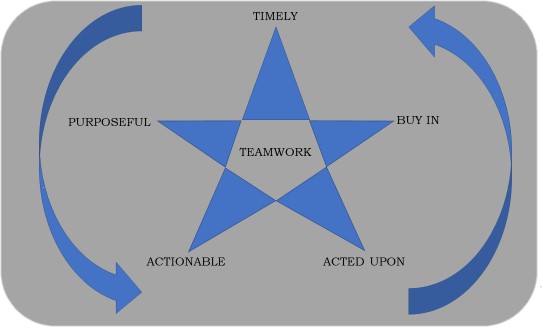
The data-driven approach is extremely effective in impacting regional crime. However, the following criteria must be met for the efforts to bear fruit.
- The data provided must be timely. Meeting to go over month-old intel doesn’t cut it. Not only is a tardy meeting a waste of practical time for command staff and analysts, it is a waste of financial and human resources for the agency.
- The data must be purposeful. The information and intelligence presented to command and patrol must have a real purpose driving it. General sharing of crime trends that have little to no chance of being corrected (petty crimes in dense and socioeconomically challenged areas) will fall on deaf ears.
- The data must be actionable. The output of cutting-edge software and the role on an analyst are ones of support. They exist to assist in the process of having command staff make decisions and patrol officers to act on those decisions.
- The data must be acted upon. The boots on the ground must be engaged in the process of taking viable information and turning it into results. All too often, massive efforts go into retrieving, preparing, and presenting valuable information only for it to be rendered useless for one of several reasons. Of course, there are always emergencies that are more pressing, situations that take precedence, and the challenges of breaking of old habits and muscle memory, but committing to action gives data their value.
- The process must have “buy in” from command staff. The expectation that these techniques will be used to combat crime must be a top priority. If not held to that standard, personnel are likely to default to what checks off the boxes of a shift rather than proactively fighting crime.
- The process must center around teamwork. Results serve to motivate those providing data, and the data need to result in arrests or closed cases. This cyclical flow is vital to the success of using data-driven policing.
Obstacles to Navigate
There are always hidden pitfalls to making a process run smoothly in a workplace, especially in law enforcement. There are almost always, however, very common obstacles that need to be addressed. One of the biggest hurdles is the fact that policing takes place 24/7 between a few distinct shifts staffed by “days on” and “days off” rotating platoons. In order for an information flow to be seamless, it must be held at a time that both days and swing shifts can attend and be held on an overlap day if possible. What cannot be communicated directly in person should be captured digitally and distributed via an intranet/internal display and discussed at each shift’s respective roll call. An intranet available on in-car computers ensures that officers have information at their fingertips.
The key to utilizing data-driven policing is to have effective communication of the findings among all stakeholders, from the analysts to the “boots on the ground.”
Notes:
1Lawrence E. Cohen and Marcus Felson, “Social Change and Crime Rate Trends: A Routine Activity Approach,” Urbana American Sociological Review 44 (August 1979): 588–608.
2Community Policing Defined (Washington, DC: Office of Community Oriented Policing Services, 2014).
3Mark Stallo, Deb Osborne, and Keith Haley, Contemporary Issues, Applications, and Techniques in Crime Analysis, 2nd ed. (Acton, MA: Copley Publishing Group, 2006).
4Cohen and Felson, “Social Change and Crime Rate Trends.”
5Cohen and Felson, “Social Change and Crime Rate Trends.”
6John E. Eck, “Police Problems: The Complexity of Problem Theory, Research and Evaluation,” in Problem-Oriented Policing: From Innovation to Mainstream, ed. Johannes Knutsson, Crime Prevention Studies, Vol. 15 (Monsey, NY: Criminal Justice Press, 2003), 79–114.
Please cite as
Sally P. Rawlings, “A Turning Point in Policing Methods: Data-Driven Policing,” Police Chief Online, April 5, 2023.